|
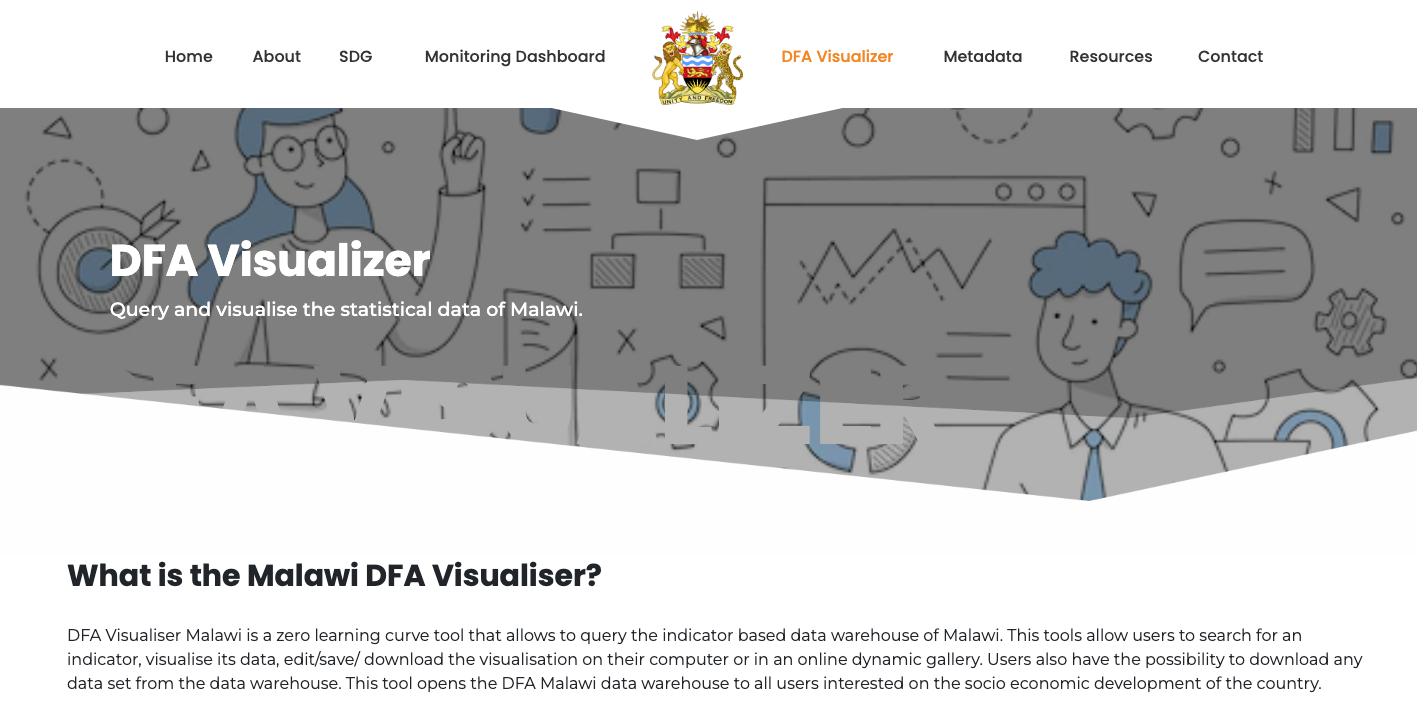
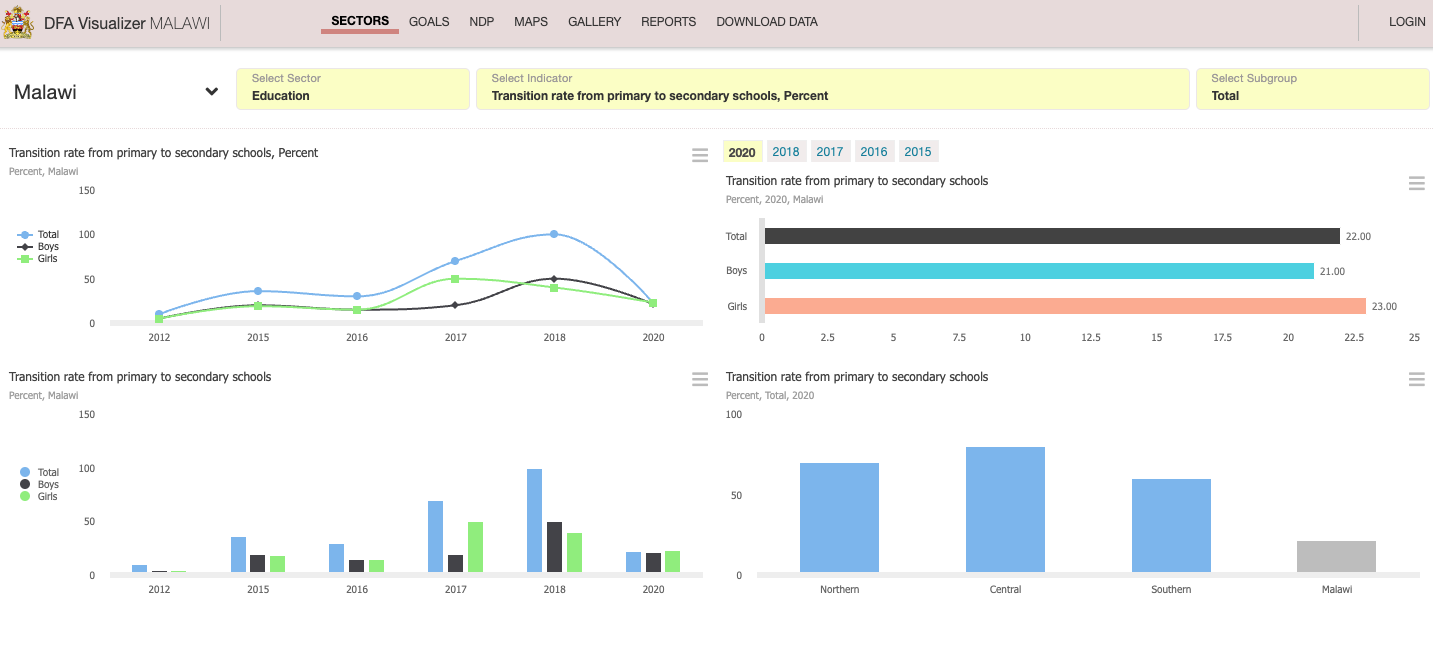
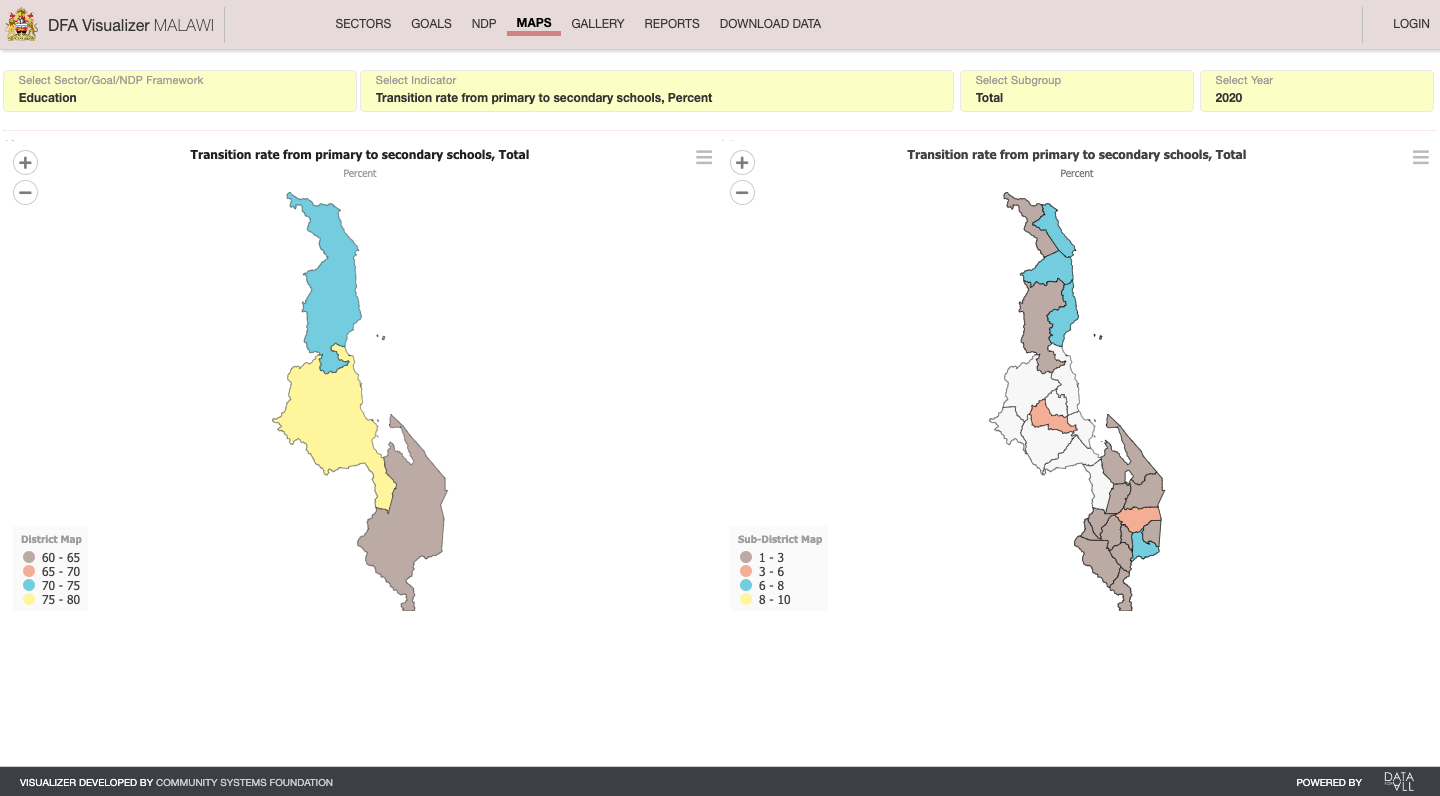
Seth Davis, Programme Advisor, Community Systems Foundation Aditya Shankar, Programme Associate, Community Systems Foundation In 2022, DFA Visualizer was rolled out for the first time in Malawi with their National Planning Office (NPO). Having previously relied on DevInfo for many years, the government faced gaps in their ability to easily disseminate key development data when the global initiative was discontinued several years ago. Through a partnership with the government, and support from the UN Resident Coordinator's Office (with funding from the World Food Programme (WFP)), Community Systems Foundation (CSF) developed and deployed DFA Visualizer, the latest software solution in the Data For All (DFA) toolkit. Data For All Visualizer is a data visualization and querying tool that supports decision makers, data analysts and individuals with sharing indicator data in easily accessible formats, such as graphs, charts and excel files. Connected to an online data warehouse, DFA Visualizer showcases indicator data from governments, organizations and agencies around the world. One aim of the tool is to promote equitable access to data by increasing the accessibility and availability of data that was not previously easy to obtain. DFA Visualizer, along with DFA Data Manager and other Data For All applications, fill the gap left by the UNICEF-led DevInfo initiative. MIP-1 Malawi Monitoring Platform To demonstrate the versatility and benefits of DFA Visualizer, the following examples will be provided in the context of Malawi's MIP-1 Monitoring Platform. The NPO is using several Data For All tools to streamline processes for data entry, analysis and visualization. This allows users to easily search for indicators related to their National Development Plan and the Sustainable Development Goals (SDGs) and visualize their multi-sectoral data. DFA Visualizer allows individuals to explore Malawi’s data warehouse across goals or sectors in different sectors or across different goals in Malawi’s NDP. This can also be done with various levels of disaggregation, such as gender, age group and location. After selecting an indicator, users can view the data across several suggested charts. These recommendations provide the user with a head start towards visualizing the data in meaningful ways. Initially, users will see bar graphs, line graphs and column charts that represent the data chosen to be visualized. These visualizations can then be modified to see the data as needed. For example, the visualization type can be updated (i.e. from a line chart to a bar chart) and the colors can be modified based on specific requirements. Users can save visualizations to their own gallery for future use. Once indicators have been selected users can modify their visualizations to suit their needs. The type, color and titles can be modified to present the users data in a unique manner. Indicators can be visualized using a geographical lens. Using the maps feature present in DFA Visualizer, decision-makers can undergo comparative analysis to determine where citizens are in most need. In the example below, the indicator “Transition rate from primary to secondary school” is being visualized. By doing so, it can be easily determined that there are districts where the transition rate is nearly 20% less than others. Indicating that targeted interventions may be needed to improve this. All data on DFA Visualizer can be downloaded to a preformatted Excel file, providing decision makers with another way to quickly look at the impact of their initiatives and programmes in specific areas to determine impact and areas of improvement. Conclusion DFA Visualizer is a versatile tool that enables easy access to data and tools to facilitate analysis. It has the potential to benefit decision-makers, policy planners, researchers and analysts by compiling and making available key development indicators from a range of data sources. DFA Visualizer allows users to reflect on most recent development indicators and draw on data to inform decisions. . As more countries begin adopting DFA Visualizer, the features and functionalities of the software will continue to expand the needs present in a variety of contexts. If you have any questions about DFA Visualizer, please contact Jon Kapp at: [email protected]
0 Comments
Leave a Reply. |
Join the CSF data revolution webinar tomorrow!
COMMUNITY SYSTEMS FOUNDATION – EST 1963
+1 212 500 1335
data-driven sustainable development


