Strengthening India’s Education Data Dissemination through Visualization Tools on U-DISE and NAS19/10/2018 Seth Davis, Communications Officer, Community Systems Foundation 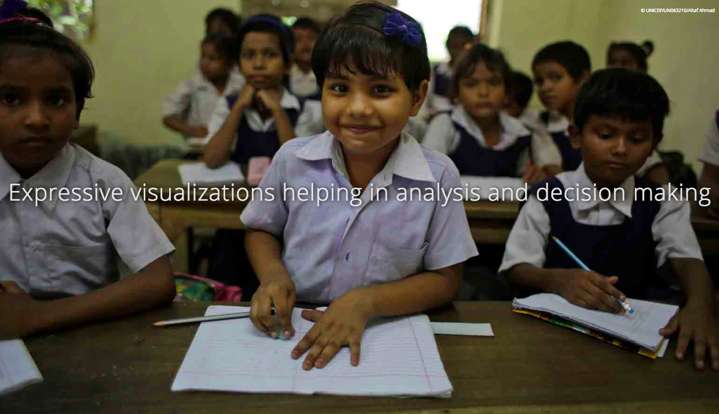 With 377,222,017 students in pre-primary, primary and secondary schools in 2018, nearly one-third of India’s total population is attending education institutions below the university level. [1]. The number of Indian school children is larger than the entire population United States - the third largest country in the world. Given this, it is critical to understand and address the current trends in education, ensuring that school, district, national goals are met. Realizing the importance of tracking and managing reliable and disaggregated data on these students, the National Institute of Education Planning and Administration (NIEPA) created the District Information System for Education (DISE) in the early 1990s. Merging with a Class 9-12 Education Management Information System (EMIS) in 2011, NIEPA renamed this nationwide EMIS as U-DISE, or Unified District Information System for Education. In 2017, UNICEF India, NIEPA and the National Council of Education Research and Training began partnering with Avalon, Community Systems Foundation’s (CSF) technology partner in New Delhi, India, to visualize this data. Following the transfer of national education data to a DevInfo SQL Database, dashboards were created on U-DISE and the National Achievement Survey (NAS). These dashboards were critical in completing a data life cycle solution. Prior to their creation, the platforms focused solely on data reporting. While this enabled reliable data collection, there were gaps between data users - education administrators and policy makers - and the producers of education data. For the first time, the U-DISE and NAS dashboards have enabled education data in India to be ‘translated’ into meaningful messages. The dashboards are the culmination of a massive data collection exercise, communicating progress that allow education officials at all levels to consider evidence in decision-making and interventions. With the Direct Primary Education Programme (DPEP) merging the two Education Management Information Systems (EMIS) associated with grades K-8 and 9-12, policymakers are now able to view this data in two dashboards. These include trends at the Elementary Level and Secondary Level. There is also a third dashboard that uses data derived from the 2011 Census to produce Demographic and Socio Economic indicators on the Indian population. This EMIS promotes data-driven decision-making to manage school education by “facilitating policy analysis and formulation, programme planning, budgeting, monitoring and evaluation of the performance of the school education system in general and development programmes in particular.” [1] 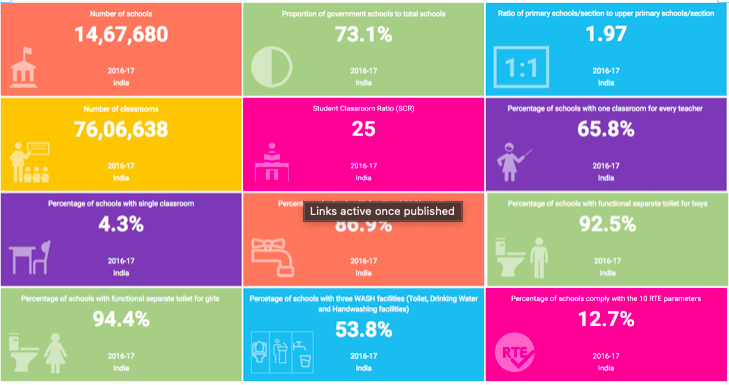 Data from the dashboard reports that 87% of schools in India have functional drinking water, while only 54% of schools have access to all three Water, Sanitation and Hygiene (WASH) facilities -- these include toilets, drinking water and handwashing facilities. 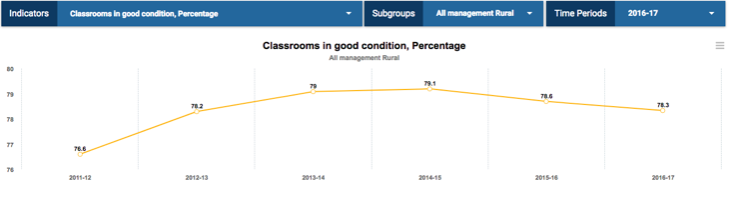 Additionally, it can be seen that from 2011 to 2014 the percentage of classrooms in good condition in rural areas increased from 76.6% to 79.1%. However, in the last several years classrooms in good condition have decreased from 79.1% to 78.3%. Considering there were 5,820,078 rural classrooms as of the 2016-2017 school year, the .8% decrease represents 46,560 classrooms and 1,117,440 students. Education planners can utilize data similar to these examples to adjust the allocation of resources to support continued improvement to rural schools. While U-DISE generates national education progress of K-12 students, and includes national census data, education officials use other data tools to better understand national progress at a more granular level. Specifically, the Education Survey Division of National Council of Education Research uses the NAS dashboard to communicate student progress on topics related to Language, Mathematics, Social Studies and Science. The NAS is taken by all students in Classes 3, 5 and 8. 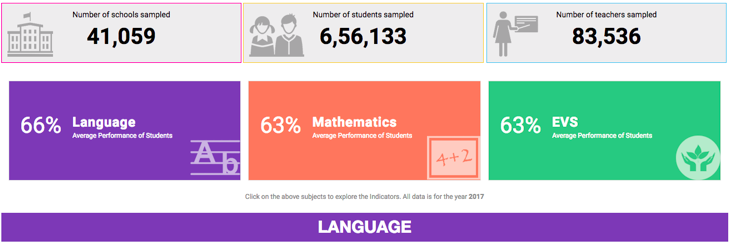 Of 656,133 Class 3 students in 2017, the average performance was 66% Language, 63% Mathematics, 63% and Environmental Studies. The NAS dashboard provides a view of this data by Gender, Location, School Management, Social Group, among others. These disaggregations allow for a more comprehensive analysis of Class 3 education. Utilizing data drawn from U-DISE and the National Achievement Survey, policy planners are able to create data-driven and evidence-based policy. Similarly, schools can use this data to better understand how they are performing and what data is available to meet the needs of their students. U-DISE and the NAS demonstrate how powerful the visualization of education data can be. CSF and its partners reaffirm a commitment to providing data-driven solutions to ensure no child is left behind. Both dashboards can be found within the School Education Information Portal. To promote wider access and use of data, mobile apps are available for both U-DISE and the National Achievement Survey. [1] UNESCO Institute of Statistics. India. 2018. Accessed at: http://uis.unesco.org/country/IN
[2] National Institute of Educational Planning and Administration (NEIPA). About the U-DISE. 2018. Accessed at: http://udise.schooleduinfo.in/about.html
1 Comment
4/3/2024 21:19:40
This article beautifully encapsulates the ongoing efforts and strides being made towards achieving universal education in India. It's inspiring to see initiatives being implemented to ensure every child has access to quality education, regardless of their background or circumstances. As a parent residing in the Hennur area, I'm particularly thrilled to learn about these advancements. It reaffirms my confidence in the education system and motivates me to actively seek out the best opportunities for my child's education. Thank you for shedding light on this crucial topic and reminding us of the importance of initiatives like "Hennur Area Schools for Your Child" in shaping a brighter future for our children. Leave a Reply. |
Join the CSF data revolution webinar tomorrow!
COMMUNITY SYSTEMS FOUNDATION – EST 1963
+1 212 500 1335
data-driven sustainable development