|
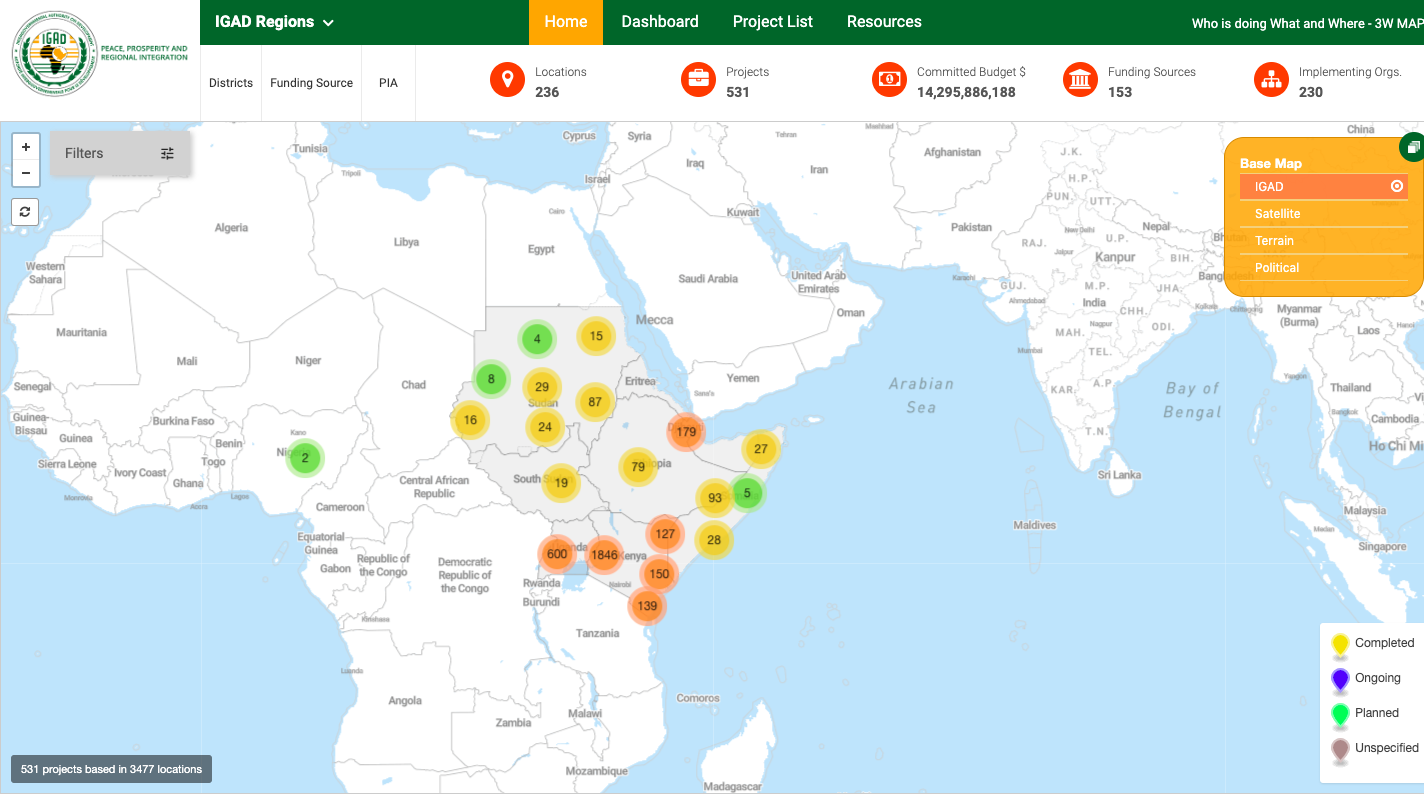
Sumer Drall, Intern, Community Systems Foundation In 2017, Community Systems Foundation (CSF) began work with the Intergovernmental Authority on Development (IGAD) East Africa to develop and deploy a solution to easily display the cross-sectoral work of the organization. The 3W (who, what, and where) Map was designed to give IGAD the ability to quickly visualize the risk of drought across the region while tracking resilience investment. (1) IGAD is a regional development organization that was founded by eight member states (Djibouti, Ethiopia, Somalia, Eritrea, Sudan, South Sudan, Kenya and Uganda) and aims to serve as “the premier regional organization for achieving peace, prosperity and regional integration in the IGAD region”. (2) The organization’s objectives range from food security, environmental protection to economic cooperation. IGAD achieves these objectives through measures such as harmonization of policies, mobilization of resources and the development of complementary infrastructure. (3) With guidance from the Platform Coordination Unit (PCU), IGAD, the 3W Map was developed by CSF Technical Staff. With the ability to disseminate data through maps, aggregations, data grids, and other visualizations, the platform serves as a coordination tool that incorporates the cross-sectoral aims of IGAD. The map visualizer tool enables users to identify where activities are being implemented and visualize allocation of project funding. (4) The platform allows member states of IGAD to store and visualize information on investment projects targeting areas of drought. Additionally, the dynamic nature of the portal modules easily reflects data changes and demands. As a key Data For All (DFA) product, the 3W map can be configured and deployed in a range of contexts. For example, 3W Maps can be utilized to compare key performance indicators to desired outcomes, overlay layers of raster and vector maps, create buffers around service delivery points to estimate service loads, and identify target populations isolated from services. The 3W Map complements IGAD’s efforts through the IGAD Drought Disaster Resilience and Sustainability Initiative (IDDRSI) which focuses on a multi-sectoral and holistic approach to drought resilience. The platform thus gives member states the ability to quickly identify the effectiveness of projects through the IGAD IDDRSI and their outcomes. (5) With user-friendly visualizations to allow better decision-making, the 3W map is one of the key components of IGAD’s knowledge management system and serves as a valuable tool to visualize risk and impact. (1) ‘Promoting effective resilience investments – Delivering peace, agriculture-led growth and socio-economic transformation in the Horn of Africa’. 2019. FAO and IGAD. Rome. Pg 55. Licence: CC BY-NC-SA 3.0 IGO
(2) "About Us ". 2019. IGAD. https://igad.int/index.php?option=com_content&view=article&id=93&Itemid=124. (3) "About Us ". 2019. IGAD. https://igad.int/index.php?option=com_content&view=article&id=93&Itemid=124. (4) "Analyze". 2019. DFA (Data For All). https://info.dataforall.org/analyze.html. (5) "Project Profile - IGAD 3W Map". 2017. Community Systems Foundation. https://www.communitysystemsfoundation.org/uploads/1/9/9/2/19920247/igad_3w_map.pdf.
0 Comments
Leave a Reply. |
Join the CSF data revolution webinar tomorrow!
COMMUNITY SYSTEMS FOUNDATION – EST 1963
+1 212 500 1335
data-driven sustainable development

